Enrollment uncertainty. A steady flow of new online and hybrid programs to the market. Intensifying competition. The pandemic accelerated these trends and turned just about everything in higher education upside down.
Yet, amid the chaos and challenge of recent enrollment cycles, a glimmer of hope emerged for a number of institutions that saw promising enrollment growth among their graduate programs.
Everspring wanted to understand these trends and uncover the ways program scale might impact a graduate program's growth potential. We explore this question in a three-part series on how scale impacts the most common and widely offered graduate business program: the MBA. Through a combination of AACSB (Association to Advance Collegiate Schools of Business) data analysis and qualitative interviews, we examine the graduate program market through the MBA lens.
- Part 1: Keeping Pace with the Dynamic, Ever-Changing MBA Market. We examine the forces shaping the conditions for the MBA market, analyzes enrollment trends across institutions of varying sizes and considers how these factors may inform planning.
- Part 2: B-school Deans from Top Programs Share Their Insights. Leaders from four institutions representing different sizes and program maturities share how they have navigated the market and their plans. We explore commonalities and differences across each institution and highlight milestones, challenges, and aspirations.
- Part 3: Navigating the Decision to Scale (Regardless of Size) and How to Get Started. We outline takeaways based on our data analysis and interviews and provide insights on how institutions might leverage their unique position in the graduate market.
As the pandemic simultaneously wanes and wears on, the importance of keeping a finger on the pulse of the dynamic, ever-changing graduate program market has never been greater. Everspring believes in the transformative power of education, and we are committed to deepening our partners’ and the higher ed community’s understanding of the market through research.
Part 1: Keeping Pace with the Dynamic, Ever-Changing MBA Market
The Undeniable Impact of COVID-19 on Graduate Education
It is impossible to talk about the current landscape of the MBA market without acknowledging the impact of the COVID-19 pandemic on the graduate degree program market overall. The pandemic exacted high tolls on enrollments of undergraduate students and graduate-level international students. However, amidst widespread decline, domestic graduate student enrollments grew.
Many institutions' graduate-level programs were more commonly delivered online before COVID, particularly in comparison to their in-person undergraduate counterparts. As COVID forced everyone online into the trials of "emergency remote learning," many graduate programs were uniquely positioned to help their institution share valuable institutional knowledge and tools as experienced practitioners of online education. By having already developed online learning capabilities, these programs, departments and entire schools were a step ahead going into the pandemic.
In this context, we developed insights intended to help institutions and stakeholders look for the first time at the impact of COVID on enrollments at a program and institutional level.
A Fluid Enrollment Environment
MBAs come in many shapes and sizes and are an industry-agnostic degree that teach a set of skills applicable to a broad range of careers (in other words, MBAs draw from a wide market of potential applicants). Some programs enroll thousands of students annually and continue to grow enrollments; others consistently enroll fewer than 100 students each year and struggle to maintain any gains.
Many graduate business program portfolios have adapted and diversified curriculum and programmatic elements to offer more students more options, either through industry-specific MBAs or degree and non-degree programs with a more specialized focus.
A recent analysis of IPEDS data from the research and advisory firm Eduventures indicates that the MBA market is in a state of decline, while other graduate business programs are attracting more students. Growth in graduate business programs focused on management sciences, analytics and quantitative methods has been explosive, while MBA programs have declined in recent years, going from 127,000 conferrals in 2019 to 120,000 in 2020.
Importantly, MBAs are increasingly offered online. Data from IPEDS shows that more than half of institutions with an MBA program offer some form of that program online, and institutions with online programs have grown more than those without an online MBA. The move toward online or hybrid modalities is well-documented and a sign of things to come not only for MBAs but for all fields of study, especially in graduate education, where prospective students are often working adults who put a premium on flexibility.
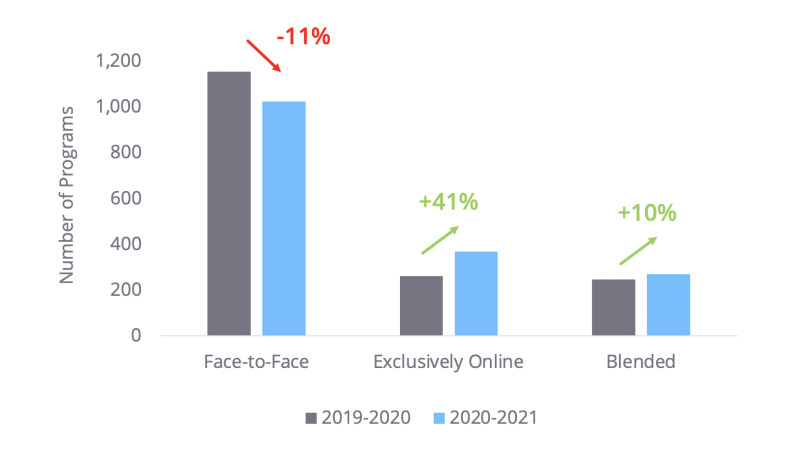
Figure 1, below, highlights the growing trend of new online or hybrid MBA programs coming to market. Between 2019 and 2020, AACSB recorded an increase in 134 MBA programs, none of which were face-to-face. In 2020, 101 fewer face-to-face programs were offered, a result of converting those programs to be offered in some capacity as an online program.
Figure 1: The Online/Hybrid MBA Migration is Well Underway
Finding Stability in a Lopsided Growth Trajectory
Our analysis shows that programs enrolling more students are not only increasing enrollments more than smaller programs but were more likely to have achieved growth.
The data showed that programs within the room to grow quartile have been in a continuous state of decline over the last five years, with enrollments decreasing by a 5.8% compound annual growth rate (CAGR) between 2016 and 2021. During the onset of COVID-19, which first impacted enrollments throughout 2020, the enrollment declines of the room to grow programs slowed but persisted. At the opposite end of the spectrum, the programs with the largest number of enrolled students—those in the giants quartile—grew over the last five years and after the onset of COVID-19. Figure 2, below, summarizes this data.
Figure 2: The Big are Getting Bigger—Enrollment Trends in the MBA Market
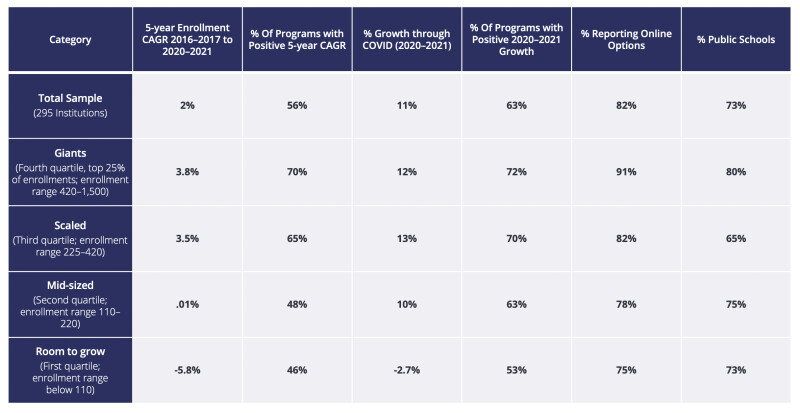
Programs within the giant’s quartile were more likely to be online and at a public institution. Not shown within the table is that COVID appears to have been an enrollment boon for more public institutions than privates, with 70% of public institutions in the sample seeing growth between 2020 and 2021, while only 50% of privates did. One possible factor contributing to this trend is that the typically lower tuition cost of a public institution’s MBA was more appealing to students who enrolled in MBA programs given the economic uncertainties that came along with COVID.
Figure 3, below, shows the five-year compound annual growth rate (CAGR) of the four categories of programs—giants, scaled, mid-sized and room to grow. Programs with more students, quite simply, grew more than programs with fewer students. Conversely, programs with less than 110 students collectively shrank.
Figure 3: Five Year Compound Annual Growth Rate of Enrollments
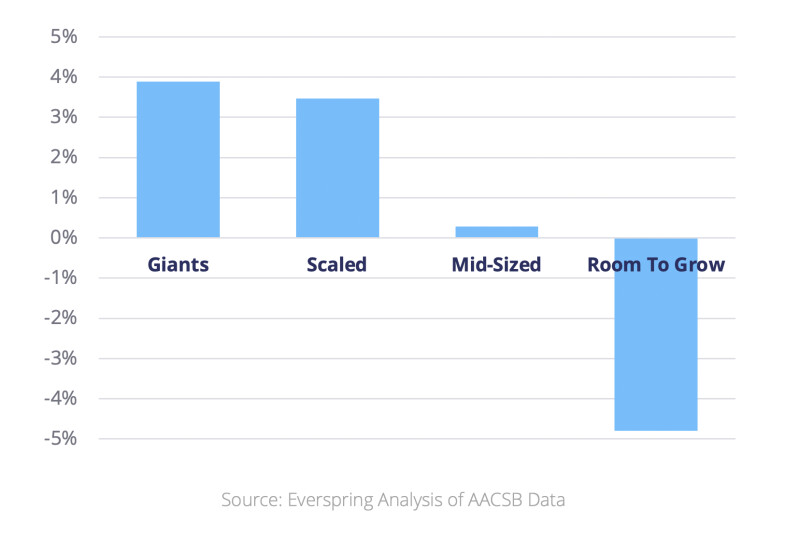
From the chart above, the key findings are as follows:
- Giants, those programs with over 420 enrollments, had a five-year CAGR of 3.8%, adding nearly 10,000 students over the last five years.
- Scaled programs had the second-largest growth, collectively increasing enrollments at a 3.4% CAGR over the last five years.
- Mid-sized programs saw minor five-year growth CAGRs, about .1%.
- The smallest set of programs declined over the period with a -4.8% CAGR.
Figure 4, below, shows a similar story in measuring the year-over-year impact of COVID-19 by comparing enrollments in the 2019–2020 academic year to 2020–2021. Here, we see the largest programs grew the most while the smallest programs shrank.
Figure 4: COVID Impact: Percentage of Enrollment Change - Fall 2020 to Fall 2021
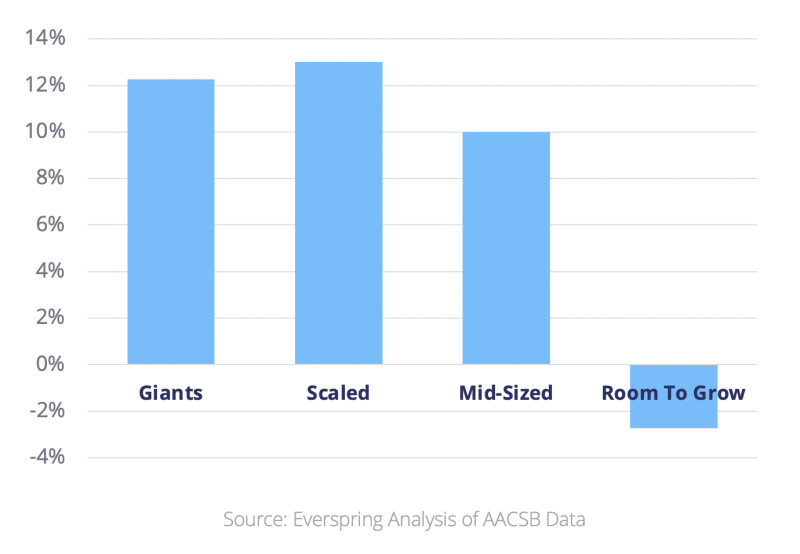
Notably, the distribution of growth is different here:
- Scaled programs grew most, up 13%, adding some 2,7000 students.
- Giant, scaled, and mid-sized programs grew at 12%, and 10%, respectively, adding nearly 6,000 and 1,000 students.
- Room to grow programs declined over the period, enrolling 2.7% fewer students compared to the previous year.
Figure 5, below, shows the longitudinal percent growth of programs by category starting in 2016.
Figure 5: Percent Change in Enrollments for MBA Programs Since 2016
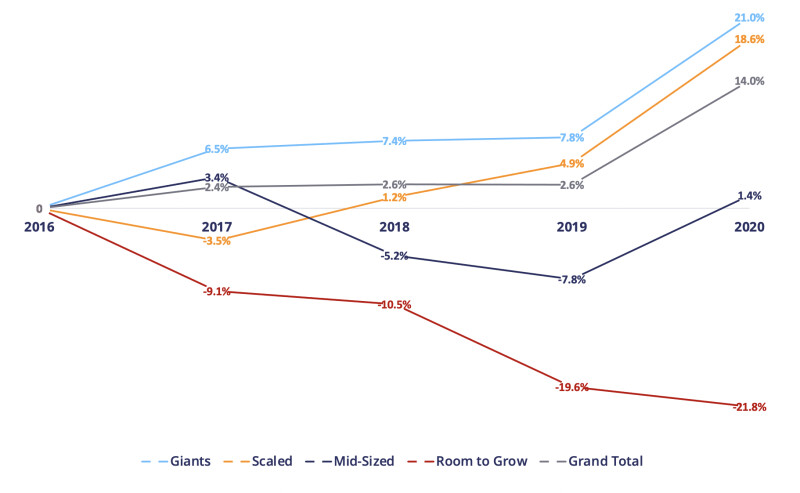
- The downward enrollment trajectory of the smallest set of programs is clear. COVID slowed the decline but did not reverse the trend.
- Mid-sized programs faced two years of consecutive decline until COVID reversed the trend.
- The two largest categories, giants and scaled programs, have seen overall growth over the last five years, but the year-over-year growth is far from consistent.
Over the coming months and years, the enrollment boon COVID brought to many institutions will likely wane—an essential input in planning in a market that is already hyper-competitive. However, it is necessary to note that demography is not destiny. Not all giant programs will realize success as so many had in recent years, and between 2019 and 2020 specifically, nor will lower enrolled programs necessarily see declines. Instead, the path towards success rests in individual, institutional strategies primarily within regional markets.
In part two of this series, we will add the context of individual institution growth to the data analysis. We will share interviews of business school leaders from four partner schools representing each of the size categories. These interviews provide a rich context of their unique journeys to scale and prepare for the future ahead.

